Blog

Why Most BESS Revenue Models Fail Under High FCAS Volatility

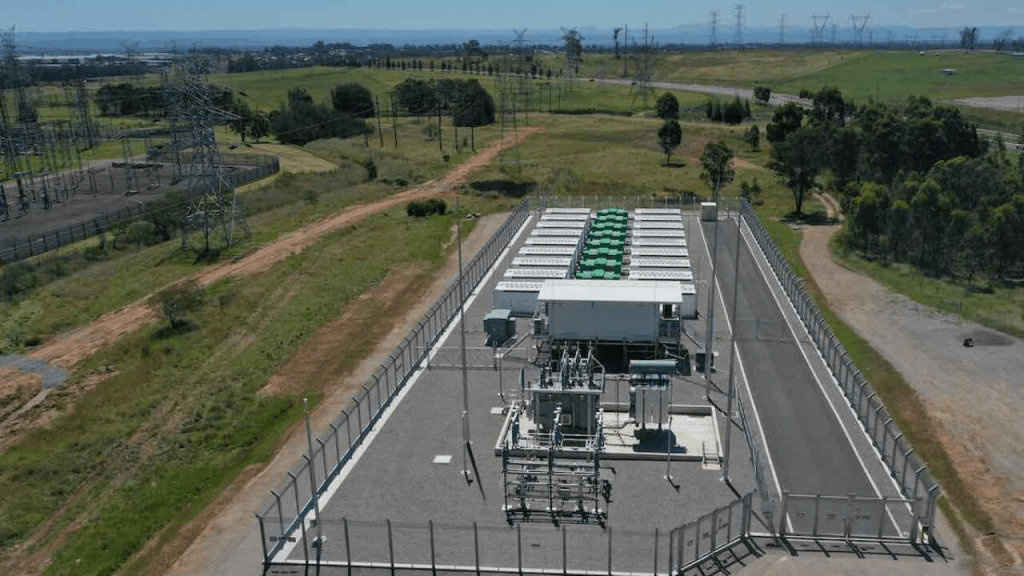
Battery Energy Storage Systems (BESS) are becoming central to NEM stability, arbitrage, and renewables integration. Yet despite rapid deployment, financial outcomes continue to diverge sharply from pre-investment revenue modelling. The common culprit: traditional modelling frameworks break down under high FCAS volatility.

2023–25 has delivered some of the most volatile FCAS conditions since the introduction of the contingency and regulation markets. Price spikes have become less predictable, event durations have become shorter and more clustered, and inter-regional price separation has intensified. Most BESS pro formas—built on smoothing assumptions or simplified dispatch logic—simply cannot capture real-world volatility.

The result? Systematically biased revenue forecasts, mis-optimised bidding behaviour, and an underestimation of portfolio risk.

This article sets out five reasons most BESS revenue models fail under high FCAS volatility, and how advanced modelling—like Northstream Analytic’s PowerStream short-term dispatch engine—overcomes these structural weaknesses.


1. FCAS Volatility Is Not Normally Distributed — But Most Models Pretend It Is

Many investment decks and banker-friendly models still assume:

  • Mean-reverting FCAS prices
  • Log-normal or normal distributions
  • Smooth temporal volatility without clustering

But the NEM’s FCAS markets consistently exhibit:

  • Heavy-tailed price distributions
  • Clustering of extreme events
  • Sudden regime shifts
  • State-dependent volatility (e.g., islanding risk, unit outages, wind ramps)

This means that using a single “average” FCAS price per service category is mathematically invalid. The tails drive the earnings: a handful of intervals can deliver >50% of annual FCAS revenue, especially for Raise/Lower Contingency services.

When models smooth this out, they under-forecast revenue in good years and over-forecast in bad years, giving investors a false sense of stability.


2. Static Capacity Allocation Assumptions Break During Price Spikes

A typical investor model sets fixed percentages of battery capacity to:

  • Energy arbitrage
  • FCAS regulation
  • FCAS contingency

But in real operations:

  • Energy and FCAS revenue stacks interact dynamically
  • The optimal allocation changes every 5 minutes
  • FCAS price spikes alter opportunity cost instantly
  • State of Charge (SOC) constraints limit which markets are viable

Static partitioning therefore suppresses upside in volatile FCAS conditions.

For example, during a high Raise 6-second event, the optimal strategy may shift from energy discharge to contingency enablement—but this shift is state-dependent and price-dependent, not rule-based.

Models that do not simulate real bidding strategy + SOC dynamics will systematically miss this.


3. SOC Constraints Under Volatility Create Nonlinear Profit Paths

Most simplified revenue models treat SOC as a linear constraint:

“Battery charges at low price, discharges at high price.”

Under FCAS volatility, SOC is instead a multi-dimensional optimisation problem involving:

  • Enablement depth
  • High-price tail events
  • Energy lost to regulation
  • Cycling limits and throughput penalties
  • Interaction with real-time AGC dispatch

This creates nonlinearities such as:

  • Being full too early → missing a late-day FCAS spike
  • Being empty during islanding risk → missing Raise contingency
  • Misaligned SOC trajectory → forced charging during expensive intervals

These complexities lead to revenue paths that no spreadsheet “averaging logic” can reasonably reproduce.

Only a constraint-based dispatch model can capture these dynamics.


4. FCAS Enablement and Compliance Are Not Perfectly Efficient

Real-world BESS operation loses revenue because:

  • Enablement often < 100% due to AGC behaviour
  • Causer-pays factors penalise poor performance
  • Compliance events reduce available MW
  • AGC movement consumes energy and reduces SOC stability
  • Thermal and inverter constraints limit maximum contingency enablement

Most revenue models assume perfect availability across all FCAS services.

This is rarely true. In fact, measured availability for some NEM assets can be as low as 70–80% after accounting for compliance and physical derating.

Ignoring this leads to:

  • Overestimated FCAS revenue
  • Underestimated degradation cycles
  • Incorrect valuation of control system quality

These errors compound under volatility.


5. Volatility Interacts With Degradation — A Hidden Cost

High FCAS volatility encourages batteries to chase short, high-value events.

But this often increases:

  • Cycling depth
  • Micro-cycling from AGC
  • C-rate stress
  • Temperature-related degradation

Degradation is nonlinear, not proportional to MWh throughput. One week of extreme FCAS activity can generate disproportionately large degradation events.

Simplified models typically assume:

  • A constant $/MWh degradation cost
  • Even cycling over time
  • No interaction between volatility and cell temperature

This is incorrect.

As FCAS volatility grows, ignoring nonlinear degradation overstates revenue and understates O&M reserves.


What a Valid BESS Revenue Model Must Include in a High-Volatility FCAS World

A robust model must integrate:

1. Five-minute NEMDE-aligned price simulation

Including scenario-based volatility and tail-event structure.

2. Full SOC trajectory modelling

Respecting charge/discharge rates, ramping, and energy constraints.

3. Co-optimised energy + FCAS bidding

Not preset allocations.

4. Compliance, enablement and AGC realism

Using empirical derating factors or control-loop simulation.

5. Nonlinear degradation modelling

Based on depth-of-cycle and stress factors.

6. Locational constraints and network constraints

Including MLF variability, curtailment risk, and islanding probabilities.


Conclusion: FCAS Volatility Rewards the Prepared and Punishes the Simplistic

As the NEM becomes more dynamic and renewable penetration increases, FCAS volatility is structurally rising—not falling. Batteries positioned to respond intelligently to this volatility will outperform their peers. But that requires models that reflect market reality, not spreadsheet mythology.

Most BESS investment models fail because they smooth what should be spiky, simplify what is nonlinear, and ignore what is stochastic.

If developers, investors, and operators want accurate forecasts, they need modelling frameworks built for volatility, not stability.

Northstream Analytic’s PowerStream modelling stack is built for this new world.

If you’d like us to run a project-specific BESS revenue assessment, reach out.

COP 30 coal pledges flow through to projected LNG demand: NS-WEM model LNG updates

Global energy markets are shifting again. At COP29 in Baku, governments launched a coordinated push for No New Coal, and the early outcomes of COP30 in Belém have continued the theme. The world is talking a big game —toward a phase-out of unabated coal power. For LNG markets, particularly through the 2030s, this has major implications if borne out in the power generation mix.

At Northstream Analytic, we have updated our NS-WEM world energy model to incorporate these scenarios. The results suggest a tightening in global LNG markets as coal-dependent countries turn to gas as well as renewables and nuclear.

Figure 1: updated NS-WEM LNG projected demand-supply balance to 2050 (COP 30 Powering Past Coal scenario)


1. Roadmap to Phase Out Fossil Fuels?

The political momentum against coal has accelerated significantly since 2024, at least in the war of words.

COP29 – The No New Coal Pledge

At COP29, 25 countries and the EU launched the Call to Action for No New Coal, a diplomatic initiative to end the construction of new unabated coal power plants and to reflect this commitment in upcoming Nationally Determined Contributions (NDCs). While not a binding global moratorium, the pledge marked a clear shift: coal expansion is now politically unpalatable for most advanced economies.

COP30 – Toward a Planned Fossil Fuel Phase-Out

COP30 has gone a step further. More than 80 countries are backing text calling for a managed phase-out of fossil fuels, with coal identified for early retirement. Side announcements include updated coal exit timelines, expanded renewable and nuclear roadmaps, and early drafts of “just transition” coal retirement strategies. Coal is on a downward trajectory in global policy aspirations.


2. South Korea’s Move: Joining the Powering Past Coal Alliance

One of the most significant coal announcements at COP30 comes from South Korea—a major industrial economy with one of the largest coal fleets in the OECD.

At COP30, South Korea announced that it would phase out thermal coal by 2040 and formally joined the Powering Past Coal Alliance (PPCA). This places the country in the group of advanced economies committed to ending new unabated coal development and charting an orderly coal exit.

The Implications

South Korea’s electricity mix is currently anchored by nuclear, gas, and coal. Coal still provides roughly 30% of its electricity, but the new commitment accelerates planned retirements. In practice, Korea will:

  • Retire and repurpose existing coal power stations (including possible CCS conversions).
  • Convert a portion of these plants to LNG-fired generation.
  • Expand nuclear capacity to provide stable, low-carbon baseload.
  • Maintain gas as a reliability and flexibility source through the 2030s.

Civil society groups are pushing for an earlier coal phase-out (2030) and a cap on gas consumption, but these are not yet reflected in official policy.


3. What This Means for LNG Demand

The coal phase-out commitments emerging from COP29 and COP30 have two competing effects on LNG markets.

a) Upward Pressure: Gas as the Bridge Fuel

For many countries—particularly in Asia—gas remains the only mature, dispatchable alternative to coal during the 2030s while renewables, grids and storage scale up. South Korea’s decisions reinforce this dynamic:

  • Retired coal capacity will partly shift to LNG.
  • 26 coal units are slated for repurposing to gas and possibly CCS.
  • Gas-fired generation remains central to system reliability.

This mirrors broader emerging market trends. As coal retires faster, LNG demand rises—at least temporarily. This is borne out continuing LNG deal flow, and as countries continue to move away from reliance on Russian gas.

Table 1: Recently signed LNG supply deals

Buyer / CounterpartySupplier / CounterpartyVolumeStart DateDurationPrice / Pricing Mechanism
Uniper (Germany)Tourmaline Oil (Canada) via US liquefaction~0.56 million t/yr2028~8 yrsNet-back pricing linked to the European TTF hub (gas sold to TTF minus shipping & handling) (Energy Intelligence)
Centrica (UK)Tourmaline Oil (Canada) via US liquefaction~0.35 million t/yr2028~10 yrsNet-back pricing linked to TTF minus shipping & handling (Energy Intelligence)
MVM (Hungary)Engie (French utility trader)~0.30 million t/yr2028~10 yrsDelivered ex-ship (d.e.s.) basis, predominantly from US volumes (Energy Intelligence)
MVM (Hungary)US supplier (unnamed)~0.30 million t/yr2028~5 yrsNot specified (Energy Intelligence)
Naturgy (Spain)Venture Global (US exporter)~1.00 million t/yr2030~20 yrsFOB (free-on-board) basis; destination-free delivery (Energy Intelligence)
Atlantic‑See LNG (Greece)Venture Global (US exporter)~0.50 million t/yr2030~20 yrsFOB basis; destination-free delivery (Energy Intelligence)

b) Downward Pressure: The Growing Anti-Gas Policy Frontier

However, LNG growth is capped by several structural factors:

  • The nuclear renaissance in key markets (including Korea).
  • Declining costs of solar, wind, and battery storage.
  • Rising scrutiny of methane emissions in gas supply chains.
  • Concerns about locking in long-lived gas assets that could be stranded by the 2040s.

Even in South Korea, climate organisations argue that gas should peak before 2030 and decline thereafter. Whether the government ultimately follows this advice will determine the shape of long-run LNG demand.


4. Northstream’s NS-WEM Results: LNG Tightens in the 2030s

Northstream Analytic’s NS-WEM model has been updated with scenarios for COP commitments, coal retirement strategies, and country-level power sector plans. Under the policy settings announced so far, the model indicates:

▶ LNG markets tighten materially through the 2030s.

  1. Coal may exit faster than previously expected across multiple regions.
  2. Gas fills much of the transitional gap before large-scale renewables, storage and nuclear are fully built out.
  3. Upstream LNG investment has been cautious due to long-term decarbonisation uncertainty, but eventually catches up to rising demand.

The result is a decade of structurally firm LNG demand from the late 2020s into the 2030s.

However, the NS-WEM also shows that beyond the mid-2030s, LNG demand plateaus and risks a decline if accelerated gas phase-down policies take hold—especially in Europe and advanced Asia.


5. Strategic Takeaways

For policymakers

  • Coal phase-out initiatives must be paired with clear long-term gas transition strategies to avoid locking in emissions and stranded assets.

For LNG market participants

  • The 2030s are shaping up as a period of tight LNG balances, supporting pricing strength and contract demand.
  • But asset lifetimes beyond 2040 require careful risk assessment.

eWaste not want not: Australia’s place in the global eWaste policy landscape

Electronic waste (e-waste) is basically any discarded product with a plug or a battery – from phones, laptops and TVs through to fridges, solar panels and EV batteries. The UN and WHO define it as end-of-life electrical and electronic equipment that often contains hazardous substances (e.g. lead, mercury, brominated flame retardants) and valuable critical raw materials (copper, gold, rare earths). (UNDRR)

Globally, the problem is now on a different scale:

  • 62 million tonnes of e-waste were generated in 2022 (7.8 kg per person), and we’re on track to reach 82 million tonnes by 2030. (E-Waste Monitor)
  • Only ~22% of that was formally collected and recycled; the rest is landfilled, informally processed or unaccounted for, wasting around US$62 billion in recoverable materials and causing serious pollution risks. (UNITAR)

Australia is a high-intensity player:

  • Australia generates ~580,000 tonnes of e-waste a year, and the average Australian produces around 22 kg per person – nearly three times the global average. (The Guardian)
  • An estimated 23 million mobile phones are sitting unused in drawers, plus many more ending up in landfill. (The Guardian)

So the policy question is: how do you keep the toxics out of people and ecosystems, stop data breaches, and capture the metals and materials back into the economy?

Below is a structured review of how major jurisdictions tackle that, where Australia sits, and where policy probably needs to go.


1. Core policy tools used internationally

Most countries mix and match a common toolkit:

  • Extended Producer Responsibility (EPR): producers/importers pay for and organise collection and recycling, often via collective schemes. (epr.sustainablepackaging.org)
  • Landfill bans / disposal restrictions: prohibit e-waste from general waste streams (e.g. Victoria, WA, parts of the EU). (Essential Services Commission)
  • Take-back schemes: free drop-off at retailers, councils and dedicated sites, funded by producers (EU, Canada, NTCRS in Australia). (Environment)
  • Eco-design / hazardous substance restrictions: requirements to minimise certain chemicals and to design for repair and recycling (EU RoHS, Korea and Japan’s resource circulation laws). (eLaw)
  • Export controls & Basel Convention implementation: managing transboundary movement to avoid “waste colonialism” – something many countries still struggle with (see recent reporting on US e-waste exports to Southeast Asia). (AP News)

How each country combines these gives you the comparative picture.


2. International approaches – who’s doing what?

European Union – WEEE “gold standard”

  • The WEEE Directive 2012/19/EU sets EU-wide rules for collection, treatment and recycling of e-waste. (Environment)
  • Producers finance systems that must meet high collection and recovery targets (e.g. 65% of average EEE placed on the market or 85% of WEEE generated). (Environment)
  • Strong focus on EPR, hazardous substance control (via RoHS), and increasingly on circular economy and critical raw materials recovery. The Directive is currently being evaluated with a 2026 revision expected to further tighten EPR and collection rules. (Environment)

Take-away: high coverage, binding targets, strong producer obligations, harmonised across member states.


Japan – tightly managed with consumer fees

  • The Home Appliance Recycling Law (2001) covers TVs, air conditioners, fridges/freezers and washing machines/dryers. Consumers pay a recycling fee, retailers take back appliances, and manufacturers must meet recycling rate targets (55–82%). (Panasonic)
  • The Act on Promotion of Recycling of Small Waste Electrical and Electronic Equipment expands to a broad set of small appliances, with municipalities organising collection and certified recyclers doing the processing. (Japanese Law Translation)

Take-away: clear roles for manufacturers, retailers, local government and consumers; high recycling rates but with visible consumer charges.


South Korea – resource circulation model

  • The Act on Resource Circulation of Electrical and Electronic Equipment and Vehicles (EEEV Act) requires producers to meet recycling obligations, design products for recyclability and restrict hazardous substances. (eLaw)
  • There are explicit recycling quotas and a strong focus on precious and rare metals recovery. (IEA)

Take-away: advanced integration of EPR with eco-design and resource-security goals.


China – WEEE fund scheme

  • China’s WEEE system is built around the Regulations on the Administration of the Recovery and Disposal of Waste Electrical and Electronic Products and a national disposal fund created in 2011. (Ministry of Ecology and Environment)
  • Producers and importers pay fees into the fund; licensed recyclers receive subsidies per unit of e-waste treated, with a product catalogue specifying covered items. (Ministry of Ecology and Environment)

Take-away: large-scale, centralised financing mechanism; strong on formal sector infrastructure, but informal recycling and enforcement remain issues.


Canada – provincial EPR for electronics

  • Canada uses provincial EPR programs: most provinces require producers/importers to finance collection and recycling of electronics (and now packaging), within a broad EPR framework. (Landbell Canada)
  • Coverage and targets differ by province, but the direction of travel is towards more comprehensive and harmonised EPR across materials. (H2 Compliance)

Take-away: strong EPR logic, but fragmented and variable performance between provinces.


United States – patchwork and export issues

  • No federal e-waste law; management is via a mix of EPA regulations and state-level EPR laws. There are over 140 EPR laws across 35 states, but only some cover electronics. (Environmental Protection Agency)
  • Recent investigations show large volumes of US e-waste exported to Southeast Asia and the Middle East under vague trade codes, despite Basel-style controls. (AP News)

Take-away: innovation and private certification (e.g. R2/e-Stewards), but nationally inconsistent and prone to “waste leakage” offshore.


Where does Australia sit in this landscape?

Broadly, ahead of the US at federal level, roughly comparable to Canada, but behind the EU/Japan/Korea on coverage, stringency and circular-economy integration.


3. Australia’s e-waste policy history and current settings

3.1 National waste and circular economy framework

  • National Waste Policy (2009, updated 2018) sets the high-level direction to avoid waste, increase resource recovery and protect the environment.
  • The National Waste Policy Action Plan 2019 set national targets including:
    • 10% reduction in total waste per person by 2030
    • 80% average resource recovery rate from all waste streams by 2030
    • bans on export of certain wastes. (DAFF)
  • In 2024, a new National Waste Policy Action Plan was released, explicitly anchoring the transition to a “safe circular economy” and aligning with SDG 12. (DCCEEW)

E-waste is nested inside this broader circular-economy narrative.


3.2 Product Stewardship Act, NTCRS and B-cycle

Product Stewardship Act 2011 / Recycling and Waste Reduction Act 2020

  • The Product Stewardship Act 2011 created a framework for mandatory, co-regulatory and voluntary schemes to manage products’ lifecycle impacts. (DCCEEW)
  • It now operates through the Recycling and Waste Reduction Act 2020, which continues to underpin national product stewardship schemes, including e-waste. (DCCEEW)

National Television and Computer Recycling Scheme (NTCRS)

  • Launched in 2011; currently operates under the 2020 Act. (DCCEEW)
  • Co-regulatory EPR scheme: importers and manufacturers of TVs, computers, printers and IT peripherals above a threshold must join approved arrangements that fund free collection and recycling for households and small businesses. (epa.nsw.gov.au)
  • The scheme has reportedly recycled over 360,000 tonnes of e-waste since inception, with targets around 66,000 tonnes per year in recent years. (DCCEEW)

Battery stewardship – B-cycle

  • B-cycle is Australia’s accredited national battery stewardship scheme, authorised by the ACCC and backed by Commonwealth, state and territory governments. (B-cycle)
  • It covers loose batteries (AA/AAA, rechargeables etc.), with producers and retailers funding collection and recycling; the aim is to create a circular system for batteries and reduce fire and toxicity risks. (B-cycle)

These schemes put Australia in the “serious but narrow” camp: some product groups are well covered; others are barely touched.


3.3 State and territory measures

  • Victoria banned all e-waste from landfill in July 2019 – anything with a plug, battery or power cord must go to designated drop-off points, not household bins. (Essential Services Commission)
  • Western Australia introduced a phased e-waste-to-landfill ban from 1 July 2024, starting with a defined list of “regulated e-waste” items. (Western Australian Government)
  • Other states and territories have a mix of local programs and transfer-station arrangements, but no nationwide landfill ban yet.

3.4 E-Stewardship and the “Wired for Change” reforms

Recognising that NTCRS + B-cycle only cover a slice of the e-waste stream, the Commonwealth has shifted to an “e-stewardship” agenda:

  • The DCCEEW E-Stewardship in Australia page (2023) flags a commitment to develop a mandatory product stewardship scheme to reduce waste from small electrical products and solar PV systems. (DCCEEW)
  • In June 2023, the “Wired for Change: Regulation for small electrical products and solar photovoltaic system waste” discussion paper proposed regulation to:
    • reduce harmful materials going to landfill
    • increase recovery and reuse of valuable materials
    • expand stewardship beyond TVs/computers to everyday electronics and solar panels. (Google Cloud Storage)
  • Ministerial priority lists in 2025 continue to highlight small electricals and solar PV as stewardship priorities, suggesting the government intends to move towards mandatory participation. (DCCEEW)

At the same time, evidence work such as the E-Product Stewardship Evidence Report shows Australian per-capita e-waste at 20.4 kg in 2019, projected to 23.4 kg by 2030, with only about 54% collected and an even smaller share actually recycled. (DCCEEW)


4. How Australia compares

Across key dimensions:

Coverage of products

  • Leaders (EU, Japan, Korea, China): broad coverage – large and small appliances, IT, consumer electronics, often vehicles and PV as well.
  • Australia: strong coverage of TVs, computers, printers and IT peripherals and loose batteries, but no national scheme yet for most small appliances, whitegoods, PV systems or embedded batteries, although reforms are in train. (DCCEEW)

Legal architecture and targets

  • EU/Japan/Korea have binding collection and recycling targets per product category, with relatively strong enforcement and eco-design linkages. (Environment)
  • Australia has national waste targets but e-waste-specific targets mainly sit at the scheme level (NTCRS, B-cycle), not as comprehensive legal obligations across all devices.

Landfill and export controls

  • Victoria and WA’s bans put parts of Australia close to EU practices, but there is no national e-waste landfill ban yet. (Essential Services Commission)
  • Like many countries, Australia still faces challenges tracking exported e-waste, but is less notorious than the US in recent reporting. (AP News)

Performance

  • Australia’s 22 kg e-waste per capita is much higher than the global average (~7.8 kg), but collection and recycling rates are middling and heavily concentrated in a few regulated product groups. (The Guardian)
  • EU and some East Asian systems achieve higher formal recycling rates but still struggle with informal flows; Australia’s key gap is coverage and consistency rather than the performance of the regulated schemes themselves.

Bottom line:
Australia is respectable but incomplete – a reasonably modern stewardship framework, but not yet scaled to the full e-waste problem.

JurisdictionPolicy ModelKey FeaturesStrengthsWeaknesses / Gaps
European Union (EU)Comprehensive EPR + Circular EconomyWEEE Directive mandates producer responsibility; high collection & recycling targets; RoHS hazardous substance restrictions; eco-design rules; strong enforcement.Global benchmark; broad product coverage; strong alignment of design and recycling; high recycling targets.Persistent informal flows; uneven performance between member states; complexity for producers.
JapanConsumer Fee + Producer ObligationHome Appliance Recycling Law; consumer recycling fees; mandatory take-back via retailers; high mandated recycling rates; small EEE program for municipalities.High-quality recycling; clear allocation of responsibility; strong roles for retailers and certified recyclers.Consumer fees may discourage proper disposal; limited coverage beyond targeted categories.
South KoreaResource Circulation + EPR + Eco-designRecycling obligations for producers; hazardous substance limits; eco-design requirements; strong focus on precious metals recovery.Integrates recycling with resource security; robust producer obligations; good performance for high-value devices.Enforcement challenges for small producers; rapid product turnover strains system.
ChinaCentralised Fund Model + Regulated RecyclersNational WEEE Fund financed by producer/importer fees; subsidies paid to licensed recyclers per unit; defined product catalogue; strict licensing.Large-scale system; strong central financing; growing formal recycling sector.Significant informal recycling persists; regional enforcement uneven; system under financial pressure.
CanadaProvincial EPR SchemesProvinces run EPR programs for electronics; producers fund collection & recycling; growing harmonisation across provinces.Mature EPR structure; broad coverage in many provinces; industry-funded.Fragmented regulatory landscape; variable targets and enforcement.
United StatesState-Level Patchwork + Voluntary CertificationSome states have electronics EPR laws; EPA guidance; voluntary recycler standards (R2, e-Stewards). No federal e-waste law.Innovation in private certification; strong private sector recycling in some states.No national framework; inconsistent rules; high levels of e-waste export.
AustraliaTargeted National EPR + State Landfill BansNational Television & Computer Recycling Scheme (NTCRS); B-cycle for batteries; Product Stewardship Act; VIC & WA landfill bans; planned expansion to small electronics & solar PV.Modern stewardship architecture; strong performance in regulated categories; expanding circular economy agenda.Narrow coverage; no national landfill ban; limited repair/reuse integration; limited focus on PV & EV batteries (but changing).

5. Expected future direction for Australia


Based on current policy signals, inquiries and consultations, you can reasonably expect:

  1. Mandatory national stewardship for small electronics and solar PV
    • The Wired for Change process and ministerial priority lists strongly suggest a move to mandatory producer responsibility for small electricals and PV, likely building on NTCRS architecture (co-regulatory arrangements, producer funding). (Google Cloud Storage)
  2. Progressive expansion of landfill bans
    • With Victoria (2019) and WA (2024) already in, other states may move in that direction, particularly if Commonwealth stewardship schemes underwrite collection and processing capacity. (Essential Services Commission)
  3. Tighter integration with circular economy and critical minerals policy
    • The 2024 National Waste Policy Action Plan and Productivity Commission work on the circular economy both frame e-waste as a materials and value-recovery issue, not just pollution control, which points towards more emphasis on high-value metals recovery and domestic reprocessing. (DCCEEW)
  4. Stronger regulation of batteries and embedded electronics
    • Recent ACCC and B-cycle decisions, plus fire and safety concerns, are already pushing towards compulsory stewardship and better design for batteries, including embedded batteries in devices. (B-cycle)
  5. More focus on data security, social outcomes and reuse
    • Public commentary highlights privacy and data-breach risks in discarded devices, and the growing role of social enterprises refurbishing phones and laptops for disadvantaged groups. (The Guardian)

6. Guidance – how should Australia proceed?

If you were sketching a direction-setting brief for government, the big moves would look something like this:

1. Move to comprehensive EPR across all e-products

  • Extend mandatory stewardship to all major e-product categories (small appliances, large whitegoods, PV, EV and stationary batteries, IoT devices).
  • Make producer fees eco-modulated – cheaper for durable, repairable, non-toxic, high-recycled-content products; more expensive for short-lived or hard-to-recycle designs. This pushes the design problem back up the chain, in line with EU practice. (Environment)

2. Implement a national e-waste-to-landfill phase-out

  • Use the Victorian and WA models to design a staged national ban, starting with high-toxicity, high-value streams (TVs/PCs, small electronics, batteries, PV) and moving outward. (Essential Services Commission)
  • Pair this with guaranteed access: minimum collection infrastructure standards (e.g. within X km for regional communities), supported by Commonwealth–state funding deals.

3. Tighten targets, transparency and enforcement

  • Set clear national collection and recycling targets for each category, aligned with or moving towards EU-style levels, and require annual public reporting. (Environment)
  • Strengthen compliance powers for the regulator under the Recycling and Waste Reduction Act, including sanctions for free-riding producers and under-performing schemes.

4. Hard-wire repair, reuse and right-to-repair into policy

  • Introduce right-to-repair measures: access to spare parts, repair information, and standardised connectors/parts where feasible.
  • Integrate reuse and refurbishment targets into stewardship schemes (e.g. minimum proportion of collected devices prioritised for reuse before recycling).
  • Fund/partner with social enterprises that refurbish devices for low-income households, schools and community groups, with strict data-destruction standards. (The Guardian)

5. Strengthen export controls and traceability

  • Tighten Basel Convention implementation and reporting for e-waste, learning from recent exposés of US exports to Asia. (AP News)
  • Require stewardship schemes to maintain chain-of-custody data, including where material is processed and what standards apply.
  • Encourage uptake of international best-practice recycler certifications but back them with audit and enforcement rather than relying purely on voluntary schemes.

6. Plan explicitly for the solar PV and large-battery wave

  • Finalise the solar PV and small electricals scheme with robust producer obligations and clear end-of-life responsibilities for panels and inverters. (Google Cloud Storage)
  • Develop separate or linked arrangements for EV and stationary batteries, focusing on safe collection, transport, dismantling and high-value materials recovery (lithium, cobalt, nickel, etc.).

7. Integrate e-waste with critical minerals and regional development

  • Treat e-waste as a secondary mining sector: GEM 2024 estimates billions of dollars in recoverable resources globally; e-waste recycling can complement Australia’s primary mining of critical minerals. (UNITAR)
  • Target some reprocessing and remanufacturing capacity to regional centres, pairing jobs and skills policies with stewardship-funded infrastructure.

7. Where this leaves Australia

In short:

  • Problem: very high per-capita e-waste, modest formal recycling, and a looming wave of PV and battery waste. (The Guardian)
  • Strengths: modern product stewardship framework, successful flagship schemes (NTCRS, B-cycle), and an emerging circular-economy policy spine. (DCCEEW)
  • Gaps: incomplete product coverage, uneven landfill controls, limited repair/reuse integration, and patchy data/export oversight.

If Australia leans into comprehensive EPR, national landfill bans, right-to-repair and stronger export controls, it can move from being a solid mid-tier performer to a front-runner, while also strengthening critical-minerals security and regional jobs.


Shifting sands: has the energy transition shifted economic and geopolitical power towards China?

The energy transition has shifted a chunk of geopolitical leverage from traditional hydrocarbon exporters toward countries that dominate clean-tech manufacturing and mineral refining, above all China. But the shift is uneven: several upstream miners (Australia, Indonesia, Chile, DRC) also gained bargaining power, while the U.S./EU/Japan are racing to “de-risk” by onshoring and diversifying.

Here are some data points.

  • Solar supply chain: China’s share of every major PV manufacturing stage (polysilicon, ingots/wafers, cells, modules) now exceeds 80%, after >US$50B of investment since 2011—giving Beijing price-setting and export leverage across a keystone technology of the transition. IEA
  • Wind turbines: Chinese OEMs (Goldwind, Envision, MingYang, Windey) topped global turbine rankings in 2024, and China accounted for ~60% of global turbine production capacity; Europe and the U.S. trailed at ~19% and ~9% respectively. This consolidation has already triggered EU subsidy probes—an indicator of strategic dependence concerns. Wood Mackenzie+1
  • Batteries & components: China regained #1 in BloombergNEF’s 2024 lithium-ion supply-chain ranking and controls a dominant share of cell manufacturing and key components (cathodes/anodes), reflecting deep midstream strength. The U.S. EIA estimates China made ~85% of battery cells by value and 74% of battery packs/components exports in 2023. BloombergNEF+1
  • Critical-minerals refining choke points: IEA’s 2025 outlook finds refining is more concentrated than mining; for most transition minerals, China’s share rose to ~86% in 2024, with China the leading refiner for 19 of 20 minerals (avg. ~70% share). That midstream dominance is where geopolitical leverage bites. IEA+1
  • Rare earths & magnets: China provides ~70% of rare-earth mine output and ~85–90% of processing. It has tightened regulatory control over the sector and previously restricted magnet-making know-how—leveraging a classic choke point (NdFeB magnets are used in wind turbines/EVs). In 2024 the U.S. still sourced ~70% of rare-earth compounds/metals from China. U.S. Geological Survey+1
  • Graphite (EV anodes): China refines >90% of battery-grade graphite and in 2023 imposed export licensing on certain graphite products—an explicit use of supply-chain leverage. IEA highlights persistent concentration risks here. fticonsulting.com+1
  • Gallium/germanium controls: Beijing’s 2023–24 export restrictions on gallium and germanium—metals crucial for chips, sensors and some clean-tech electronics—demonstrated coercive capacity rooted in ~98% and ~68% shares of global output respectively. CSIS+1
  • According to a study by the United States Studies Centre at the University of Sydney, Australia imports about 96% of its solar modules from China. ussc.
  • Counter-balancing shifts upstream: Resource holders have not been sidelined—some gained power by forcing domestic value-add. Indonesia’s nickel ore export ban (from 2020) pulled in large Chinese investment and made Indonesia the center of new HPAL/refining capacity, reshaping EV supply chains. Australia remained the largest lithium miner (2024), though much is refined in China—illustrating miners’ leverage tempered by midstream dependence. Investing News Network (INN)+3IEA+3IEA+3

Summary: Traditional petrostates still matter for oil & gas during the transition, but strategic leverage is clearly migrating to midstream refining and manufacturing nodes—and today those nodes are overwhelmingly in China. That’s why the U.S., EU, Japan and Australia are pouring money into non-Chinese refining (e.g., rare-earths via Lynas in Malaysia) and local clean-tech factories, and why Beijing’s targeted export controls immediately move markets. Reuters+2wsj.com+2

Not divided not conquered: Samuels Review finally hits home

Last 7 days

  • Bill introduced & sales pitch: The government tabled its Environment Protection Reform Bill 2025, pitching it as a fix for slow approvals and stronger protections, with a push to pass it by year-end. Reuters+2Minister for the Environment and Water+2
  • No split: The Coalition asked to split streamlining from tougher protections; Labor and key business voices rejected that, saying a split kills certainty. ABC+2ABC+2
  • Ministerial “override” flashpoint: Drafts indicate a national-interest override letting the minister approve projects inconsistent with new standards—Watt says it won’t be used for coal/gas; critics call it a carve-out. The Guardian+1
  • Climate “trigger” ruled out: The bill won’t include a climate trigger to block high-emitting projects; instead, emissions disclosure/mitigation plans are flagged. Greens say that’s not enough. ABC
  • Stakeholders diverge: Business wants clarity and speed; environment groups warn about discretion, offsets, and enforcement teeth; Greens want a climate test. Reuters+2ACF+2

What’s in the bill (headlines)

  • National Environment Standards with an “unacceptable-impact” test to knock out projects with irreversible harm up-front. Reuters+1
  • Independent EPA-style regulator for compliance/enforcement, while final approvals stay with the minister (subject to published reasons). The Canberra Times+1
  • Streamlined approvals via clearer rules and fewer Commonwealth/State duplications. Reuters
  • Offsets/restoration pushed toward “net-positive”/“nature-positive” outcomes (details still contentious). Allens
  • Harsher penalties & stop-work powers to lift compliance. Reuters

Where the fights are

  • Override power: Environmental groups fear the national-interest override blunts the standards; government says it’s narrow and accountable. The Guardian+1
  • Climate test: No climate trigger is a hard red line for the Greens; Labor argues Samuel didn’t recommend one and prefers other climate tools plus disclosure. ABC
  • Offsets & “net-positive”: Concerns over like-for-like, permanence, and leakage. ACF
  • Split vs package: Business and Labor want a single package; Coalition still pressing for a split to fast-track approvals. ABC+1
  • Litigation risk: Lawyers flag early court tests around definitions (eg, unacceptable impact, override scope). Capital Brief

How it lines up with the 2020 Samuel Review

Samuel Review (2020)Bill direction this week
Legally enforceable National Environment Standards; decisions (including accredited state processes) must be consistent with them. Rare, reasoned public-interest override permitted. DCCEEWStandards form the core; unacceptable-impact gate built in. A national-interest override is included with reasons—exact guardrails are politically hot. Reuters+1
Independent compliance & enforcement separated from politics (EPA-like office). DCCEEWEPA-style regulator created for monitoring/enforcement; minister retains approvals. Debate is over independence/teeth. The Canberra Times
Streamline & accredit states against Standards to cut duplication. DCCEEWStreamlining is central—explicit aim to reduce duplication/timeframes. Reuters
Better data & measurable standards; move toward granular, quantitative tests. DCCEEWDirectionally aligned; details on datasets/thresholds still to surface publicly. Reuters
Climate: consider climate scenarios in impact/avoid-mitigate hierarchy, but no separate “climate trigger” in EPBC. DCCEEWNo climate trigger (consistent with Samuel’s framing), with emissions disclosure/mitigation planning instead. ABC

Kamchatka shaky: 8.8 one of the largest in history – highlights Fukushima learnings and instant Pacific tsunami warning effect


1. Event Overview

On July 30, 2025, at around 07:01 UTC, a powerful earthquake with a moment magnitude of 8.8 struck approximately 119 km east‑southeast of Petropavlovsk‑Kamchatskiy, Kamchatka Peninsula, Russia. It’s the strongest earthquake in the region since 1952 (Reuters) and one of the largest ever recorded. Lucky it didn’t hit in a vulnerable heavily-populated area! Longe-range tsunami warnings across the Asia-Pacific did their job and were triggered immediately, with emergency warnings issued in Russia itself, and Japan and Hawaii.


2. Geological Details

• Depth & Epicenter

The quake occurred at a shallow depth of ~19 km (12 miles) beneath the seafloor (Reuters).

• Tectonic Context & Cause

This rupture occurred along the Kuril‑Kamchatka subduction zone, where the dense Pacific Plate subducts beneath the Okhotsk Plate at convergence rates of ~86 mm/yr. These megathrust-type earthquakes generate the largest events in this region (Wikipedia).

• Aftershocks

Several strong aftershocks followed, with magnitudes up to ~6.9, as noted by the USGS and local monitoring authorities. Although aftershock activity is ongoing, no significantly larger main shocks are expected in the near term (Reuters).


3. Damage & Regional Impact

• Russia’s Far East

  • Severo‑Kurilsk and surrounding coastal settlements experienced partial flooding from tsunami waves up to ~4 m high.
  • A kindergarten was damaged, and there were reports of power outages in Sakhalin region.
  • Several injuries, including people hurt during evacuation or jumping from windows, but no confirmed fatalities (Reuters, Sky News).

• Japan

  • Extensive evacuations, especially in Hokkaido and northeastern coastal regions, with over 900,000 people advised to move.
  • Tsunami waves of up to ~60 cm (~2 ft) were recorded; no damage or casualties reported.
  • Fukushima nuclear plant workers were evacuated as a precaution; no abnormalities observed (The Guardian).

• Pacific Basin (Hawaii, U.S. West Coast, Canada, etc.)

  • In Hawaii, tsunami waves of approximately 1–1.2 m (3–4 ft) struck—robust evacuation alerts were issued, though no major damage reported so far. Some small flooding occurred in shoreline zones.
  • Tsunami watches extended along the West Coast of the U.S., British Columbia, Alaska, Guam, Ecuador, New Zealand, and other Pacific coastal areas; wave heights up to 1–3 m were forecast in many locales (CBS News, Reuters, News.com.au, The Guardian, The Washington Post).

4. Tsunami Risk & Response

  • Immediate tsunami warnings issued across the Pacific (see network map below): including Hawaii (see Hawaii box below), Japan, the U.S. West Coast, Canada, New Zealand, Ecuador, Guam, among others (People.com, The Guardian, News.com.au).
  • Recorded wave heights:
    • Kamchatka/Severo‑Kurilsk: up to ~4 m
    • Hawaii: ~1–1.2 m recorded
    • Japan: up to ~0.6 m
  • Evacuation orders, port closures, and emergency shelters activated widely. NWS and local authorities stressed prolonged risk as multiple waves and strong currents continued (Reuters, The Wall Street Journal, News.com.au).


5. Implications & Broader Significance

  • This quake is among the six strongest recorded globally, and the largest in Kamchatka since the 1952 Mw 9.0 Severo‑Kurilsk earthquake, which generated ~18 m tsunamis and caused widespread devastation in the Kuril Islands (Wikipedia).
  • Highlights ongoing seismic and tsunami risk in subduction zones along the Pacific “Ring of Fire.”
  • Underlines the critical importance of early warning systems, evacuation plans, and preparedness—especially given lessons from past events (e.g., 2011 Tōhoku, 1952 Kuril) (forms2.rms.com).
  • In Japan, the event prompted reflection on resilience of nuclear infrastructure and continued community readiness.

6. Summary Table

AspectDetails
Date & TimeJuly 30, 2025; ~07:01 UTC
Magnitude8.8
Depth~19 km (12 miles)
Epicenter119 km ESE of Petropavlovsk-Kamchatsky, Kamchatka
Tectonic SettingMegathrust along Kuril‑Kamchatka Trench
AftershocksSeries up to ~6.9; ongoing, no stronger quake expected
DamageFlooding, damage to infrastructure, injuries in Kamchatka
Tsunami Impact4 m at origin, smaller waves further afield
Evacuations IssuedRussia, Japan (900,000 people), Hawaii, Pacific coasts
FatalitiesNone confirmed
SignificanceLargest since 1952; underscores subduction-zone hazard

NEM mid-July update

Here’s a high-level snapshot of the National Electricity Market for July 1–17, 2025:

  • Spot Prices
    Wholesale spot prices have remained elevated into mid-winter. June 2025 saw an average NEM spot price of $232/MWh (up 139% on May’s $96/MWh) (Leading Edge Energy). By July 11, instantaneous trading prices in the 08:30–09:00 interval were around $183.11/MWh (nems.emcsg.com).
  • Major Generation Outages
    Planned and unplanned outages have tightened supply: Yallourn Unit 3 was offline Jul 5–12 for a scheduled overhaul (560 MW), and Eraring Unit 5 tripped unexpectedly Jul 10–14 (~720 MW) (nemoutages.azurewebsites.net, aemo.com.au).
  • Wind & Solar Output
    Solar and wind continue to contribute strongly. AEMO forecasts overall solar curtailment under 1% but notes some large plants face >25% cuts due to network constraints (PV Magazine Australia); real-time data show combined wind+solar often exceeding 3.5 GW during daylight peaks (aemo.com.au).
  • Renewables Share
    In Q1 2025, renewables supplied a record 43% of NEM energy (ecogeneration.com.au); mid-July month-to-date renewable penetration remains above 40%, driven by wind, solar and hydro (aemo.com.au).
  • Hydro News
    Snowy Hydro’s Snowy 2.0 pumped-storage project has completed key factory acceptance testing, keeping its 2.2 GW/350 GWh in-system by 2028 on track (Snowy Hydro, Snowy Hydro).
  • Battery News
    Fluence was selected for the 300 MW/600 MWh Wellington BESS, due to start construction Q4 2025 (Yahoo Finance). Envision Energy and FERA Australia also inked a deal to build up to 1.5 GWh of storage alongside 1 GW of wind generation (Taiwan News).
  • Major Price Spikes & Negative Events
    A cold snap on June 11 drove spot prices above $7,000/MWh in all five regions during evening peaks (WattClarity). Conversely, high solar export/low overnight demand has triggered multiple negative-price dispatch intervals, with the market floor at -$1,000/MWh observed in early July (utilizer.com.au, aer.gov.au).

VNI West and the Challenges of Transitioning Australia’s Grid

AKA another budget and timeline blowout…….

The Victoria to New South Wales Interconnector West (VNI West) is one of Australia’s most significant energy infrastructure projects. Designed to connect renewable energy zones across Victoria and southern NSW, the project is a critical component of the Australian Energy Market Operator’s (AEMO) Integrated System Plan (ISP). It aimed to support the decarbonisation of the National Electricity Market (NEM) and provide reliable, low-emissions energy to homes and businesses.

Project Scope and Origins

The project:

  • VNI West is a proposed 500 kV double-circuit transmission line, approximately 240 km long.
  • It will connect the Western Renewables Link in Victoria to Transgrid’s Dinawan substation in southern NSW.
  • The initial proposal appeared in AEMO’s ISP in 2018, with formal cost-benefit analysis undertaken via the Regulatory Investment Test for Transmission (RIT-T) process.
  • AEMO and Transgrid completed the Project Assessment Conclusions Report (PACR) in May 2023.
  • Transmission Company Victoria (TCV), established by AEMO, is the project proponent in Victoria.

Governance, Financing, and Ownership

To understand how VNI West is progressing, it is important to examine how the project is being managed and financed.

  • The project is overseen by AEMO and the Australian Energy Regulator (AER).
  • Transgrid leads the NSW portion; TCV leads the Victorian portion.
  • The project will ultimately be owned by the successful bidder for TCV, likely to be one of the consortia shortlisted by AEMO.
  • Financing includes:
    • Estimated project cost: AUD $3.96 billion (2022–23 dollars).
    • Federal government concessional finance via Rewiring the Nation: AUD $750 million.
    • CEFC concessional loan: AUD $140 million.
    • Private equity: nearly AUD $700 million committed by Transgrid security holders.

Budget Overruns and Delays

Despite its promise, VNI West has encountered several challenges, particularly around cost and timing.

  • VNI West was initially planned to be operational by 2028.
  • Delays have pushed the delivery timeline to late 2030.
  • Cost inflation across transmission components (lines, substations, materials) has increased the project’s cost base by up to 55%.
  • Regulatory and landholder engagement processes have further delayed the project.

Broader Cost Blowouts

VNI West is not alone in facing overruns. A comparison with other major infrastructure projects reveals a common trend.

ProjectOwner/DeveloperOriginal Budget & TimelineRevised Budget & Timeline
VNI WestTCV / Transgrid$3.96 bn, due 2028+55% cost, delivery now 2030
Snowy 2.0Snowy Hydro$2 bn (2017), due 2021$12 bn; full delivery by 2028
HumeLinkTransgrid$1.35 bn, due ~2028~$5 bn, timeline under review
EnergyConnect (NSW-SA)Transgrid / ElectraNet~$2.3 bn, due 2024-25Delays ongoing, cost increases noted

Reasons for Overruns

These cost and timeline blowouts are driven by a complex interplay of factors.

  • Cost escalation in raw materials, skilled labour shortages.
  • Complex geotechnical conditions (e.g., Snowy 2.0 tunnel delays).
  • Environmental and cultural heritage assessments extending planning timelines.
  • Strong community resistance to transmission lines and land access issues.

Coal Generator Closure Schedule

The timing of new infrastructure like VNI West was meant to be closely tied to the scheduled closure of existing coal-fired generators. These closure dates are approaching, and not surprisingly, governments are looking to do deals to keep them open a bit longer.

StationStateCapacity (MW)OwnerCommissionedPlanned Closure
YallournVIC1,480EnergyAustralia19732028
Loy Yang AVIC2,210AGL1985-1994Mid-2030s
EraringNSW2,640Origin Energy1982-19842027*
LiddellNSW2,000AGL19712023 (closed)
HazelwoodVIC1,600Engie (formerly)19712017 (closed)

*Note: The NSW government is exploring an extension of Eraring’s operation beyond 2027 due to market supply concerns.

Debate For and Against VNI West

The VNI West project has sparked a significant public and policy debate. Supporters argue the project is essential for integrating renewables and replacing coal. Critics point to high costs, environmental concerns, and community opposition.

In Support:

  • Unlocks over 3 GW of renewable generation capacity.
  • Reduces electricity prices by lowering congestion and allowing excess renewables to be exported.
  • Supports system reliability and coal retirements.

Against:

  • High cost and long delivery timeline may not match urgent coal closure dates.
  • Strong community opposition from landholders and regional communities.
  • Environmental impact and landscape fragmentation.
  • Suggestions for alternative routes or underground cabling not adopted.

Conclusion

The VNI West project exemplifies the multifaceted challenges of Australia’s energy transition. While the need for expanded transmission is undeniable in the face of imminent coal closures, the social, engineering, geotechnical, and financial barriers are substantial.

A key issue highlighted by VNI West and other large energy infrastructure projects, is the inadequacy of initial costing and scheduling processes. Project proponents often release cost estimates early in the planning phase. These early-stage costings are showing to be optimistic and do not account for the long lead times and inevitable delays caused by regulatory approvals, stakeholder negotiations, and construction challenges.

By the time projects reach the construction phase—sometimes several years after initial estimates—the cost environment has changed substantially. Materials, labour, land access, and financing costs can escalate well beyond original assumptions, rendering initial budgets obsolete. There is now ample evidence, particularly from projects like Snowy 2.0, HumeLink, and VNI West, that initial estimates are regularly exceeded by billions of dollars.

Planners and regulators need to build greater contingency—or “fat”—into early cost projections. Future-proofing cost estimates with higher allowances for inflation, uncertainty, and delay risk would provide a more honest representation of total project cost. This approach would not only enhance financial transparency but also improve public confidence in the delivery of critical infrastructure.

Don’t underestimate one in a hundred year events…..

That’s the key message from the recent flooding disaster in Texas on the 4th July holiday weekend and the stark warning for Australian planners and policy makers. What happened around the Guadalupe River in Kerr County, was catastrophic from dual perspectives of loss of life, and, the failure of preparation and warning procedures. It should highlight to us in Australia, that even in this era of social media and hyper- connectedness, with many learnings from past disasters, we’re still prone to being beaten by the elements. In Texas, the combination of natural events, the physical environment and human failures stacked the odds overwhelmingly against not only campers, hikers and people on the roads, but people just sitting in their homes. Harrowing stories are coming out about people sitting in houses washed off their foundations. Such failures to alert and assist these people and obvious flaws in planning and systems points to a need to ensure that our Australian emergency tools and processes are ready. Australian policy makers and governments will be getting briefed on what happened in Texas, not only on what happened in terms of planning, warnings, preparation, but also a more specific analysis of what sites and terrain match the perfect storm of geography, slope, soils, creek confluences, narrow gorges, rainfall funnels, dry soils. This article takes a high level look at some of the issues.

The obvious starting point would be immediately reviewing the traditional 1-in-100+ methodology of quantifying risk and allocating resources. It’s clear that climate related disasters are happening more often.

In relation to the recent disaster in Texas, you might wonder why people were sleeping in tents, sitting in their homes, driving in their cars, while record levels of rainfall, and torrents of rainwater were churning down multiple creek beds funnelled into the gorges in the Guadalupe River on a obvious collision course. People simply didn’t know the size of the catastrophe.

Here are some key learnings for Australia:


🇦🇺 🔍 1. Don’t underestimate 1-in-100 flood risks in rural and hilly terrain in Australia

Australia’s Great Dividing Range, Blue Mountains, Victorian Alps, Far North QLD, and Tasmanian highlands share key characteristics with Texas Hill Country:

  • Impermeable soils and steep terrain
  • Sudden convergence of creeks into narrow river systems
  • Growing peri-urban development in hazard zones

➡️ We need more detailed flash flood modelling, GIS-based hazard overlays, and localised evacuation triggers based on real topography, not just postcodes. Here are some examples of risk sites, from a basic AI screening:

a. Shoalhaven River, NSW (Kangaroo Valley – Tallowa Dam – Nowra)

  • 🏞️ Steep upper catchment in Morton National Park and Budawang Ranges
  • ⛺ Numerous campsites near Kangaroo Valley and Yalwal and Coolendel
  • ⚠️ Known for fast river rise, limited warning downstream in Nowra

📍Comparable to Guadalupe River’s upper forks and hill terrain


b. Macquarie River & Fish River, NSW (Bathurst – Hill End – Wellington)

  • 🏞️ Steep gorges (Macquarie Pass, Fish River Gorge)
  • 🛶 Popular for camping/fishing
  • ⚠️ Flash floods possible when tributaries rise in isolation, especially above Bathurst

📍Similar to mid-river zone of Guadalupe, with junction dynamics


3. Barrington River & Gloucester River, NSW

  • 🏞️ Very steep terrain in Barrington Tops NP
  • 🌲 Fast-flowing rivers with confluences near Gloucester
  • ⛺ Multiple riverside cabins + farm-stay tourism operators

📍Similar to Camp Mystic zone — remote riverside accommodation downstream of gorges


c. Ovens and Buckland Rivers, VIC (Bright – Porepunkah – Harrietville)

  • 🏞️ Steep alpine catchments in the Victorian Alps
  • ⚠️ Rapid storm runoff → flooding in Bright and along Ovens River
  • 🏕️ Many holiday parks, riverside walks, and schools camps

📍Similar to Guadalupe tributaries near summer camps


d. Broken River, VIC (Delatite – Mansfield region)

  • 🏞️ Steep terrain, narrow valleys near Lake Nillahcootie
  • 🛶 Popular for outdoor education camps and kayaking
  • ⚠️ Confluence zones prone to rapid flooding

e. Fitzroy River, QLD (Carnarvon Gorge – Rockhampton)

  • 🏞️ Steep gorges upstream in Carnarvon NP
  • ⛺ Tourists and bushwalkers often unaware of rainfall upstream
  • ⚠️ Flash floods possible from upstream rain not visible locally

📍Risk: Sudden river rise in dry weather = dangerous camping


f. Bellingen & Never Never Rivers, NSW

  • 🏞️ Tributaries from Dorrigo Plateau → steep descent into gorges
  • ⛺ Prominent riverside campsites and swimming holes (e.g. Promised Land)
  • ⚠️ Fast runoff and poor phone reception = dangerous flash flood profile

🔍 Summary of risk factors:

FeatureRisk Factor
Creek confluencesMultiplying discharge rapidly
Narrow gorgesSudden rise and surge effect
Steep terrainFast runoff, no absorption
Upstream national parksRainfall may be unseen downstream
Downstream tourismCampsites, cabins, low situational awareness

⚠️ 📢 2. Warning Systems Must Be Universal, Not Opt-In

In Texas:

Local authorities relied on an opt-in app (CodeRED) and failed to activate the national IPAWS system — many campers and residents got no warning at all.

In Australia:

  • We rely on text alerts, RFS apps, and media, but there is fragmentation between states and LGAs.
  • Not everyone uses apps like Hazards Near Me or VicEmergency.

➡️ Australia must ensure that:

  • Emergency alerts are mandated at the national level
  • Redundancy exists across SMS, radio, TV, apps, and satellite messaging
  • Geo-targeted alerts are tested and mandatory for local councils

🏕️ 🎯 3. Holiday Period Risk Must Be Actively Managed

In Texas:

The flood hit during the Fourth of July holiday — campsites, cabins, riverside properties were full of people unaware of the danger.

In Australia:

  • Bushfires, storms, and floods peak in holiday season (Dec–Feb)
  • Coastal and inland camping hotspots (e.g. Shoalhaven, Snowy Valleys, Otways) are highly exposed

➡️ Australia needs:

  • Proactive seasonal risk bulletins
  • Localised hazard dashboards for visitors
  • Integration of hazard alerts into tourism platforms, Airbnb, and campground booking systems

🛰️📡 4. Geospatial Risk Mapping Must Be Open and Usable

Texas had fire and flood data — but the visualisation and communication of risk was lacking. Maps were not integrated into decision-making in real time.

Australia has:

  • Good geospatial hazard data (NSW SEED, QRA Flood Viewer, VicGov’s Fire History layers)
  • But still lacks real-time, citizen-facing GIS tools for:
  • Address-based risk summaries
  • Evacuation zone overlays
  • Live rainfall + river telemetry in one place

➡️ There’s a major opportunity for:

  • Public-facing risk dashboards using AI + GIS
  • Interactive evacuation planning tools per LGA
  • Open-source address-level hazard reporting tools (especially for rural councils)

🌡️🌪️ 5. Climate Amplification Is Here Now

The Texas flood was supercharged by:

  • Warm Gulf air → extreme moisture
  • Drought-hardened soil → more runoff
  • Increased storm persistence due to atmospheric blocking

Australia faces the same pattern:

  • La Niña years = east coast flood clusters
  • Hotter atmosphere = heavier rainfall per storm
  • Drought → Fire → Storms → Floods (in a destructive cascade)

➡️ Every hazard planning document and infrastructure design code must now include climate-amplified scenarios.
That means:

  • Shorter return periods for “1-in-100-year” events
  • More flexible evacuation planning
  • Dynamic, scenario-based emergency simulations

🧠 Final Takeaways

Texas LessonAustralian Response
Opt-in warning failedMandate cross-platform alerts
Terrain amplified floodsUpdate flood models for steep catchments
Holiday timing worsened impactIntegrate hazard comms into tourism systems
GIS underusedBuild citizen-ready hazard dashboards
Climate intensified rainfallPlan for compound, not isolated, events

Comparative Analysis of Global e-Waste Policies

1. The e-Waste Problem: Scope and Urgency

What is e-Waste? Electronic waste (e-waste) includes discarded electrical and electronic equipment (EEE) such as computers, televisions, mobile phones, appliances, and data centre hardware. These items often contain toxic materials (lead, mercury, cadmium, flame retardants) and valuable resources (gold, silver, rare earths).

Why it is a Problem

  • Environmental harm: Improper disposal can lead to soil and water contamination.
  • Health risks: Exposure to hazardous substances poses threats to human health, especially among informal waste workers.
  • Resource loss: Recoverable materials worth over USD 60 billion are lost annually.
  • Data security: Devices often contain sensitive data that, if not securely erased, could lead to breaches.

Scale of the Problem

  • In 2022, global e-waste generation reached 62 million tonnes (Mt).
  • By 2030, it is projected to grow to 82 Mt.
  • Only ~22% of this waste is formally collected and recycled.

2. Methodology: Comparison and Ranking Framework

To evaluate national and regional e-waste policies, we use the following criteria:

  1. Policy Comprehensiveness: Scope of products covered by legislation.
  2. Extended Producer Responsibility (EPR): Obligation on producers to manage end-of-life disposal.
  3. Collection & Recycling Rates: Official data on performance.
  4. Enforcement & Oversight: Legal framework and compliance mechanisms.
  5. Innovation & Infrastructure: Technological and process-based responses.
  6. Transparency & Data Reporting: Regular, verifiable reporting.
  7. Data Sanitisation Policies: Regulations governing secure erasure of sensitive data.
  8. Data Centre Specific Policies: Inclusion of servers and infrastructure in waste and data governance.

3. Comparative Analysis

See end of document for acronyms used.

Country/RegionEPR & Product CoverageCollection RateData Sanitisation RegulationData Centre ProtocolsEnforcementComments
EU (Germany, France)Mandatory WEEE, all EEE~42%GDPR mandates secure erasureGuidance under EU waste and cybersecurityStrongModel framework, high compliance
UKWEEE and DPA~40-45%UK DPA enforces secure data destructionNHS and DEFRA-aligned data centre policiesStrongInnovation (e.g., Royal Mint e-waste plant)
USAState-level EPR, sectoral lawsVaries (5-35%)NIST 800-88, HIPAA, GLBAR2/e-Stewards common in data centresMediumStrong certification, patchy federal law
CanadaProvincial EPR (EPRA etc.)~30-40%PIPEDA requires protection, no national e-waste erasure standardProvincial guidesMediumSome harmonisation through EPRA
AustraliaPartial EPR (TVs, computers)~54% collected, <20% recycledNo national data erasure lawsVoluntary NABERS Waste rating, no mandatory ITADWeakLacks mandatory scope, no uniform policy
New ZealandPriority product declaration~2-3% recoveryPrivacy Act requires safe disposal but not enforcedNo official ITAD policiesVery WeakMinimal recycling infrastructure

4. Australia’s Policy Landscape: Strengths and Deficiencies

Strengths

  • National Television and Computer Recycling Scheme (NTCRS): EPR covers computers and TVs.
  • Export Restrictions: Australia has banned the export of unprocessed e-waste, aligning with the Basel Convention.
  • State Landfill Bans: Some states (e.g., Victoria, SA) ban e-waste in landfills.
  • NABERS Data Centre Waste Rating: Voluntary tool for sustainability metrics.

Major Gaps

1. Limited Product Scope

  • NTCRS only covers TVs, desktops, laptops, printers.
  • No inclusion of small household appliances, mobile phones, servers, or solar PVs.

2. No National Standard for Secure Data Erasure

  • Australia lacks a dedicated federal mandate requiring certified data erasure for IT equipment.
  • The Privacy Act 1988 provides general obligations to protect personal information, but it does not prescribe technical standards for data destruction.
  • Australian Prudential Regulation Authority (APRA) Prudential Standard CPS 234 requires regulated entities to manage information security, but compliance enforcement and data destruction procedures remain ambiguous.
  • Australian Signals Directorate (ASD) offers the Information Security Manual (ISM), which includes guidance on media sanitisation but is only mandatory for government agencies.
  • Australian Security Intelligence Organisation (ASIO) and other national security stakeholders recommend destruction protocols but offer no enforceable national standard across the private sector.
  • There is no requirement for tools like Blancco or compliance with NIST 800-88 or ISO/IEC 27040.

3. Data Centres Unregulated at End-of-Life

  • No mandatory requirement for data centres to follow certified ITAD processes.
  • NABERS Waste for Data Centres is voluntary and lacks enforcement mechanisms.
  • The Security of Critical Infrastructure Act 2018 (SOCI) mandates cyber and physical risk management for critical infrastructure, but does not yet mandate certified end-of-life IT disposal or sanitisation.

4. Fragmented State-Level Approaches

  • Landfill bans and e-waste handling rules vary significantly by state.
  • No unified national standard or framework ties together states under a consistent operational model.

5. Reporting and Oversight

  • No national register of e-waste processors, recyclers, or ITAD providers.
  • No public transparency or compliance reporting regime equivalent to EU registers.

5. Best Practices & Global Leadership

World Leaders

  • Germany: Robust EPR, recycling targets, and data governance.
  • UK: Enforces data destruction, high transparency, innovative recovery.
  • France: Strong market compliance and regulatory tools.
  • USA: Strong sectoral enforcement and use of certified ITAD.

Innovations

  • Royal Mint (UK): Recovers precious metals from PCBs.
  • Greenbox/Excess (Australia): Voluntary ITAD services with certifications.

Key Lessons

  • Integrate data security and environmental protection in law.
  • Mandate data centre e-waste handling.
  • Use certification (e.g., ISO 27001, R2) as compliance tools.

6. Recommendations for Australia

  1. Expand NTCRS Product Coverage
    • Include mobile phones, small devices, servers, modems, PV systems.
  2. Mandate Secure Erasure
    • Amend Privacy Act and critical infrastructure rules to require certified sanitisation.
    • Use NIST 800-88 or ISO/IEC 27040 as baseline.
  3. Enforce ITAD in Data Centres
    • Make NABERS Waste certification mandatory.
    • Require device-level tracking and sanitisation logs.
  4. Unify State Landfill Policies
    • National coordination on landfill bans for all e-waste.
  5. Create a National Reporting Platform
    • Public, real-time data on recycling volumes, erasure compliance, and audit results.

7. Conclusion

Australia has foundational e-waste and privacy laws but lags significantly behind world leaders in scope, enforcement, and integration. To prevent environmental degradation, data breaches, and economic waste, Australia must modernise its policy framework and hold producers, recyclers, and data centre operators accountable.

The convergence of e-waste and cybersecurity regulation is not just best practice—it is essential for Australia’s transition to a secure, circular economy.

AcronymFull Term
EPRExtended Producer Responsibility
EEEElectrical and Electronic Equipment
WEEEWaste Electrical and Electronic Equipment
GDPRGeneral Data Protection Regulation
DPA (UK)Data Protection Act (United Kingdom)
NHSNational Health Service (UK)
DEFRADepartment for Environment, Food and Rural Affairs (UK)
HIPAAHealth Insurance Portability and Accountability Act (USA)
GLBAGramm-Leach-Bliley Act (USA)
NISTNational Institute of Standards and Technology
PIPEDAPersonal Information Protection and Electronic Documents Act (Canada)
ITADIT Asset Disposition
NABERSNational Australian Built Environment Rating System
NTCRSNational Television and Computer Recycling Scheme
PVPhotovoltaic (solar panels)
ISOInternational Organization for Standardization
MtMillion tonnes
R2Responsible Recycling Certification
PCBPrinted Circuit Board
ISO/IECInternational Organization for Standardization / International Electrotechnical Commission

References

  • UN Global e-Waste Monitor (2024)
  • PwC Australia e-Waste & Data Risk Report (2023)
  • NABERS Data Centre Waste Guide (2024)
  • Australia Department of Climate Change, Energy, the Environment and Water
  • Iron Mountain Secure ITAD Australia
  • Blancco Global Data Erasure Study (2022)
  • WHO e-Waste Fact Sheet
  • Basel Convention Implementation Reports