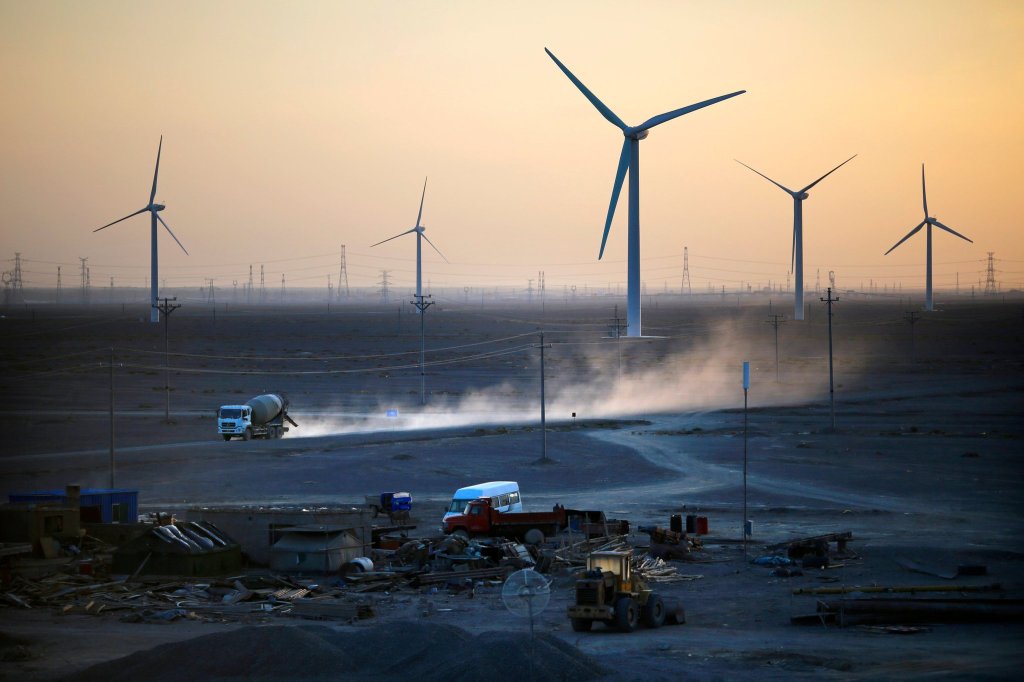
Global energy markets are shifting again. At COP29 in Baku, governments launched a coordinated push for No New Coal, and the early outcomes of COP30 in Belém have continued the theme. The world is talking a big game —toward a phase-out of unabated coal power. For LNG markets, particularly through the 2030s, this has major implications if borne out in the power generation mix.
At Northstream Analytic, we have updated our NS-WEM world energy model to incorporate these scenarios. The results suggest a tightening in global LNG markets as coal-dependent countries turn to gas as well as renewables and nuclear.
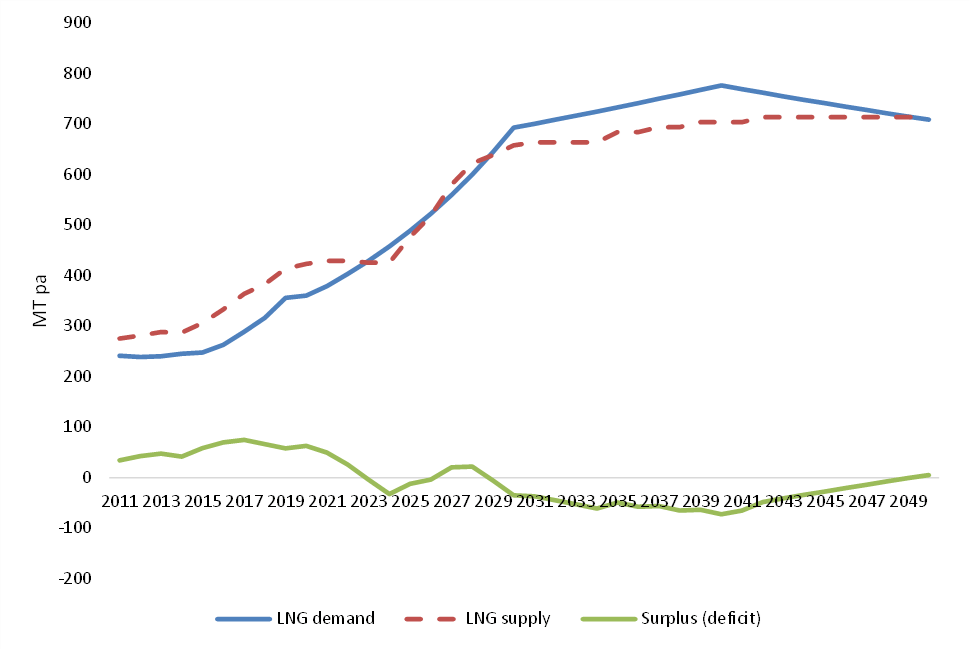
Figure 1: updated NS-WEM LNG projected demand-supply balance to 2050 (COP 30 Powering Past Coal scenario)
1. Roadmap to Phase Out Fossil Fuels?
The political momentum against coal has accelerated significantly since 2024, at least in the war of words.
COP29 – The No New Coal Pledge
At COP29, 25 countries and the EU launched the Call to Action for No New Coal, a diplomatic initiative to end the construction of new unabated coal power plants and to reflect this commitment in upcoming Nationally Determined Contributions (NDCs). While not a binding global moratorium, the pledge marked a clear shift: coal expansion is now politically unpalatable for most advanced economies.
COP30 – Toward a Planned Fossil Fuel Phase-Out
COP30 has gone a step further. More than 80 countries are backing text calling for a managed phase-out of fossil fuels, with coal identified for early retirement. Side announcements include updated coal exit timelines, expanded renewable and nuclear roadmaps, and early drafts of “just transition” coal retirement strategies. Coal is on a downward trajectory in global policy aspirations.
2. South Korea’s Move: Joining the Powering Past Coal Alliance
One of the most significant coal announcements at COP30 comes from South Korea—a major industrial economy with one of the largest coal fleets in the OECD.
At COP30, South Korea announced that it would phase out thermal coal by 2040 and formally joined the Powering Past Coal Alliance (PPCA). This places the country in the group of advanced economies committed to ending new unabated coal development and charting an orderly coal exit.
The Implications
South Korea’s electricity mix is currently anchored by nuclear, gas, and coal. Coal still provides roughly 30% of its electricity, but the new commitment accelerates planned retirements. In practice, Korea will:
- Retire and repurpose existing coal power stations (including possible CCS conversions).
- Convert a portion of these plants to LNG-fired generation.
- Expand nuclear capacity to provide stable, low-carbon baseload.
- Maintain gas as a reliability and flexibility source through the 2030s.
Civil society groups are pushing for an earlier coal phase-out (2030) and a cap on gas consumption, but these are not yet reflected in official policy.
3. What This Means for LNG Demand
The coal phase-out commitments emerging from COP29 and COP30 have two competing effects on LNG markets.
a) Upward Pressure: Gas as the Bridge Fuel
For many countries—particularly in Asia—gas remains the only mature, dispatchable alternative to coal during the 2030s while renewables, grids and storage scale up. South Korea’s decisions reinforce this dynamic:
- Retired coal capacity will partly shift to LNG.
- 26 coal units are slated for repurposing to gas and possibly CCS.
- Gas-fired generation remains central to system reliability.
This mirrors broader emerging market trends. As coal retires faster, LNG demand rises—at least temporarily. This is borne out continuing LNG deal flow, and as countries continue to move away from reliance on Russian gas.
Table 1: Recently signed LNG supply deals
| Buyer / Counterparty | Supplier / Counterparty | Volume | Start Date | Duration | Price / Pricing Mechanism |
|---|---|---|---|---|---|
| Uniper (Germany) | Tourmaline Oil (Canada) via US liquefaction | ~0.56 million t/yr | 2028 | ~8 yrs | Net-back pricing linked to the European TTF hub (gas sold to TTF minus shipping & handling) (Energy Intelligence) |
| Centrica (UK) | Tourmaline Oil (Canada) via US liquefaction | ~0.35 million t/yr | 2028 | ~10 yrs | Net-back pricing linked to TTF minus shipping & handling (Energy Intelligence) |
| MVM (Hungary) | Engie (French utility trader) | ~0.30 million t/yr | 2028 | ~10 yrs | Delivered ex-ship (d.e.s.) basis, predominantly from US volumes (Energy Intelligence) |
| MVM (Hungary) | US supplier (unnamed) | ~0.30 million t/yr | 2028 | ~5 yrs | Not specified (Energy Intelligence) |
| Naturgy (Spain) | Venture Global (US exporter) | ~1.00 million t/yr | 2030 | ~20 yrs | FOB (free-on-board) basis; destination-free delivery (Energy Intelligence) |
| Atlantic‑See LNG (Greece) | Venture Global (US exporter) | ~0.50 million t/yr | 2030 | ~20 yrs | FOB basis; destination-free delivery (Energy Intelligence) |
b) Downward Pressure: The Growing Anti-Gas Policy Frontier
However, LNG growth is capped by several structural factors:
- The nuclear renaissance in key markets (including Korea).
- Declining costs of solar, wind, and battery storage.
- Rising scrutiny of methane emissions in gas supply chains.
- Concerns about locking in long-lived gas assets that could be stranded by the 2040s.
Even in South Korea, climate organisations argue that gas should peak before 2030 and decline thereafter. Whether the government ultimately follows this advice will determine the shape of long-run LNG demand.
4. Northstream’s NS-WEM Results: LNG Tightens in the 2030s

Northstream Analytic’s NS-WEM model has been updated with scenarios for COP commitments, coal retirement strategies, and country-level power sector plans. Under the policy settings announced so far, the model indicates:
▶ LNG markets tighten materially through the 2030s.
- Coal may exit faster than previously expected across multiple regions.
- Gas fills much of the transitional gap before large-scale renewables, storage and nuclear are fully built out.
- Upstream LNG investment has been cautious due to long-term decarbonisation uncertainty, but eventually catches up to rising demand.
The result is a decade of structurally firm LNG demand from the late 2020s into the 2030s.
However, the NS-WEM also shows that beyond the mid-2030s, LNG demand plateaus and risks a decline if accelerated gas phase-down policies take hold—especially in Europe and advanced Asia.
5. Strategic Takeaways
For policymakers
- Coal phase-out initiatives must be paired with clear long-term gas transition strategies to avoid locking in emissions and stranded assets.
For LNG market participants
- The 2030s are shaping up as a period of tight LNG balances, supporting pricing strength and contract demand.
- But asset lifetimes beyond 2040 require careful risk assessment.